|
Scalable Compression, Replay and Extrapolation of Communication and I/O Traces in Massively Parallel Environments
Frank Mueller+, Martin Schulz*, Bronis R. de
Supinski*, Todd Gamblin*, Xiaosong Ma+, Philip Roth#
Michael Noeth+, Sundeep Budanur Ramanna+, Prasun Ratn+, Karthik Vijayakumar+, Xing Wu+
+ Department of Computer Science, North Carolina State University, Raleigh, NC
*Lawrence Livermore National Laboratory, CASC,
Livermore, CA
#Oak Ridge National Laboratory, Oak Ridge, TN
|


|
ScalaTrace
Characterizing the communication behavior of large-scale applications is a difficult and costly task due to code/system complexity and long execution times. While many tools to study this behavior have been developed, these approaches either aggregate information in a lossy way through high-level statistics or produce huge trace files that are hard to handle. We contribute an approach that provides orders of magnitude smaller, if not near-constant size, communication traces regardless of the number of nodes while preserving structural information. We introduce intra- and inter-node compression techniques of MPI events that are capable of extracting an application's communication structure. We further present a replay mechanism for the traces generated by our approach and discuss results of our implementation for BlueGene/L. Given this novel capability, we discuss its impact on communication tuning and beyond. To the best of our knowledge, such a concise representation of MPI traces in a scalable manner combined with deterministic MPI call replay are without any precedent.
ScalaTrace Results - NAS PB Experiment
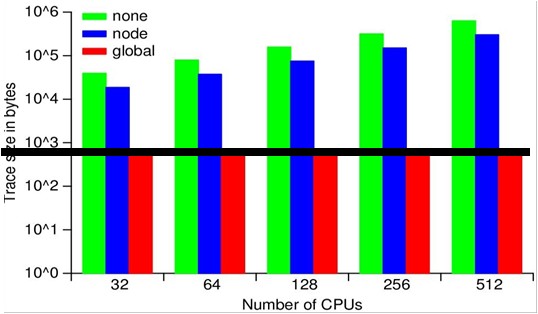
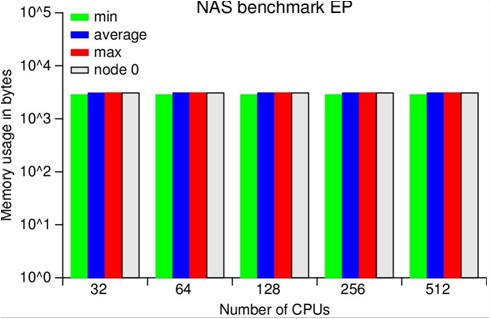
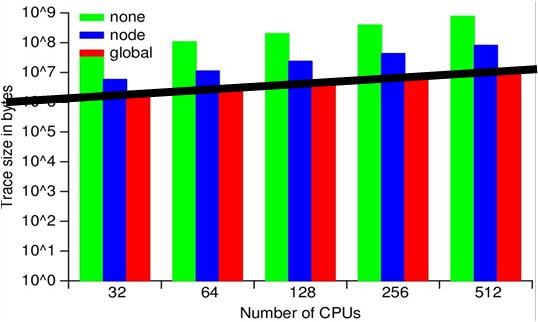
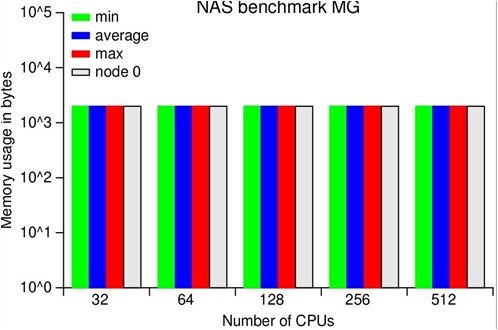
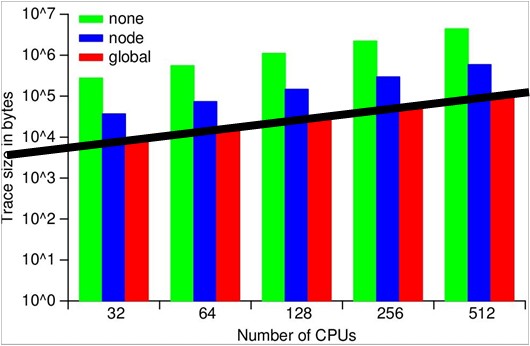
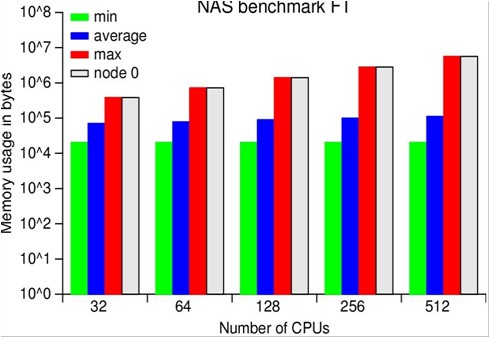
We assess the effectiveness of our framework through experiments using the MPI NAS benchmarks as well as large, scientific applications on BlueGene/L. Our results confirm the scalability of our on-the-fly MPI trace compression by yielding orders of magnitude smaller or even near constant size traces for processor and problem scaling. ScalaTrace uses a bi-level compression approach: after creating trace records for each observed MPI event, we first perform node local (intra-node) compression, followed by a global (inter-node) compression step. Both steps must provide lossless, yet space-efficient compression requiring us to extract and to store the underlying structure of the communication. As a result, we can represent repetitive MPI events in loops with identical parameters in constant size.
The figures show the trace file sizes for the NPB suite on a
log-scale. We can distinguish three categories of codes, those that
result in near constant-size traces, regardless of the number of
nodes, those with sub-linear scaling of trace size as the node count
increases and those that do not scale (yet). DT, EP and IS exhibited
near-constant trace sizes irrespective of number of tasks; LU and MG
showed sub-linear scaling with number of tasks; and BT, CG, and FT
resulted in faster growing non-scalable traces sizes.
The runtime overhead is depicted on a logarithmic scale with
intra-node compression and with inter-node compression. The first two
include the overhead of writing a trace file per node to the parallel
file system while inter-node includes the overhead of inter-node
compression and that of writing the compressed trace at the root node.
ScalaReplay
We replayed compressed traces to ensure MPI semantics are preserved to verify that the aggregate number of MPI events per MPI call matches that of the original code and that the temporal ordering of MPI events within a node are observed. The results of communication replays confirmed the correctness of our approach.
ScalaReplay Results - NAS PB Experiment
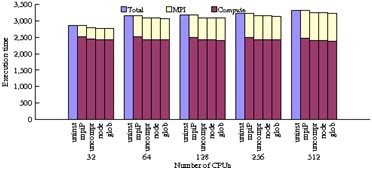
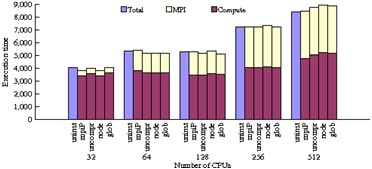
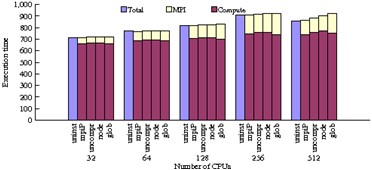
The figures below depict the aggregated wall-clock times across all nodes for NPB codes. For each set of results, five bars are shown:
Bar 1: Original aggregated application execution time.
Bar 2: Aggregated execution time when linked with mpiP.
Bar 3: Aggregated replay time with no compression (flat).
Bar 4: Intra-node compression aggregated replay time.
Bar 5: Global compression aggregated replay time.
Global compression includes both intra and inter-node compression. We measure the times for bars 2 - 5 with mpiP and report the mpiP-measured communication and computation time. The data produced by mpiP also supports comparison of statistical data of call frequencies during replay with the mpiP run. These results validate that the replay engine correctly emulates the application's MPI usage. We varied the task count for each benchmark to assess the effect of strong scaling on the measured metrics.
ScalaExtrap: Communication Extrapolation
Performance modeling for scientific applications is an important task for assessing potential performance, bottlenecks and assist in hardware procurement for high-performance computing (HPC) systems. Currently, modeling is performed through a tedious process of code inspection and manual model development, sometimes complemented by microbenchmark evaluations and application tracing on a given platform.
Recent progress on communication tracing provides novel opportunities for communication modeling. The latest communication tracing techniques achieve lossless trace collection, preserve event ordering and encapsulate time in a scalable fashion. However, estimating the impact of scaling on communication efficiency is still non-trivial due to execution-time variations and exposure to hardware and software artifacts.
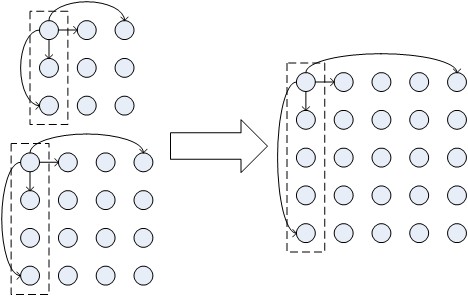
This work contributes a fundamentally different performance modeling scheme than past approaches. By extrapolating communication traces (see topology extrapolation in figure) and execution time of a parallel application, a set of traces for smaller number of compute nodes provides the base to synthetically generate a trace for larger number of nodes. The extrapolated trace can subsequently be (a) replayed to empirically detect scalability problems and (b) analyzed to detect communication patterns or determine constraints on scalability.
Communication Extrapolation
Results
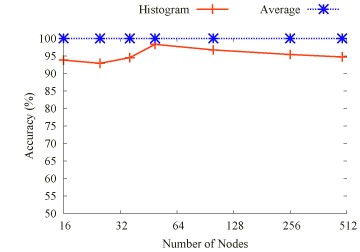
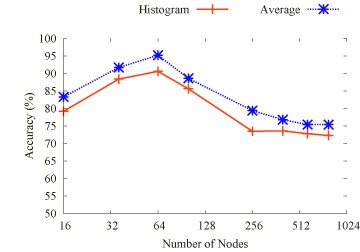
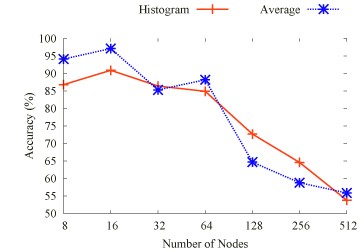
We evaluated the timing extrapolation results with static trace comparison. Figure above depicts the extrapolation accuracy of the 2D Stencil, BT, EP, FT, IS and LU codes respectively, for a varying number of nodes (on a log-scale x-axis). We observe that, for each of the 2D Stencil, BT, EP, and FT benchmarks, the average extrapolation accuracy is higher than 70%, in case of the 2D Stencil benchmark and EP as high as 90%.
ScalaIOTrace: Multi-level I/O Capture
As supercomputer performance approached and then surpassed the
petaflop level, I/O performance has become a major performance
bottleneck for many scientific applications. Several tools exist to
collect I/O traces to assist in the analysis of I/O performance
problems. However, these tools either produce extremely large trace
files that complicate performance analysis, or sacrifice accuracy to
collect high-level statistical information. We propose a multi-level
trace generator tool, ScalaIOTrace, that collects traces at several
levels in the HPC I/O stack. ScalaIOTrace features aggressive trace
compression that generates trace files of near constant size for
regular I/O patterns and orders of magnitudes smaller for less regular
ones. This enables the collection of I/O and communication traces of
applications running on thousands of processors.
Our contributions also include automated trace analysis to collect selected statistical information of I/O calls by parsing the compressed trace on-the-fly and time-accurate replay of communication events with MPI-IO calls. We evaluated our approach with the Parallel Ocean Program (POP) climate simulation and the FLASH parallel I/O benchmark. POP uses NetCDF as an I/O library while FLASH I/O uses the parallel HDF5 I/O library, which internally maps onto MPI-IO.
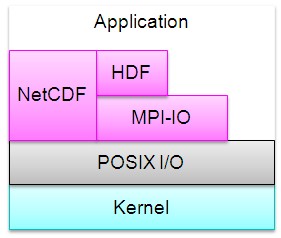
Multi-Level IO Tracing
|
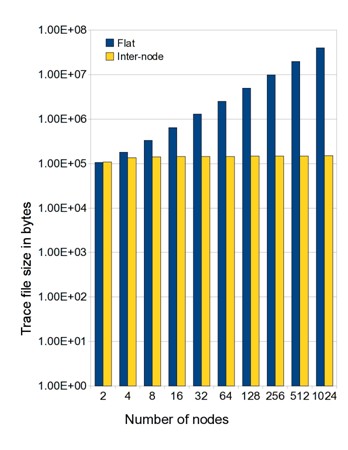
FlashIO: Perfect compression
|
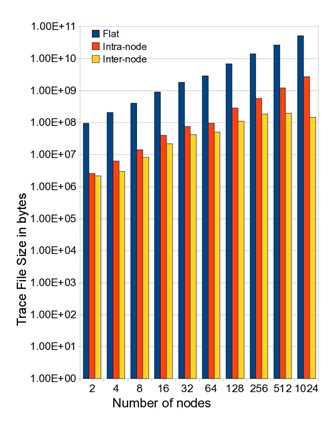
POP: 2 orders magn. less
|
We evaluated our ScalaIOTrace prototype in two aspects: (1) its effectiveness of communication-I/O trace file compression, and (2) its capability of collecting statistical information on I/O and communication activities via replaying the compressed traces. For such evaluation, we experimented with (1) a complex parallel I/O benchmark, Flash I/O [1], which is closely modeled after the FLASH astrophysics code, and (2) a production-scale climate simulation application, the Parallel Ocean Program (POP).
Flash I/O results depict the size of trace files generated by two approaches over increasing number of nodes, both on log scale. The size of the uncompressed trace files grows linearly with increasing number of nodes. The reason for this behavior is that each node writes its own trace file and the number of files created grows with the increase in the number of nodes. In contrast, the size of the inter-node compressed traces is almost constant under strong scaling.
POP results show the trace file size for different types of trace collections by varying the maximum blocks allocated to nodes. The figure shows that intra-node compression alone can reduce the trace file size by an order of magnitude. Not surprising, internode compression brings further trace size reduction. However, unlike observed in our previous experiment with FLASH I/O, internode compression here fails to obtain near-constant trace file sizes. Instead we see a linear increase in the file size up to 256 nodes. Then, trace file sizes flatten for 512 and 1024 nodes since timestep behavior becomes more regular at 1024 nodes resulting in more effective inter-node compression at this size.
Download:
Publications:
-
"Scalable I/O Tracing and Analysis" by Karthik Vijayakumar, Frank Mueller, Xiasong Ma, Philip C. Roth in Petascale Data Storage Workshop, Nov 2009.
-
"ScalaTrace: Scalable
Compression and Replay of Communication Traces in High Performance Computing"
by M. Noeth and P. Ratn and F. Mueller and M. Schulz and B. de
Supinski,
Journal of Parallel and Distributed Computing, V 69, No 8, Aug 2009, pages 969-710.
-
"Preserving Time in Large-Scale Communication Traces"
by P. Ratn and F. Mueller and M. Schulz and B. de
Supinski
in International Conference on Supercomputing, Jun 2008, pages 46-55.
-
"Scalable Compression and Replay of Communication Traces in Massively Parallel Environments"
by M. Noeth and F. Mueller and M. Schulz and B. de
Supinski in International Parallel and Distributed Processing Symposium, Mar
2007, Best Paper Award.
-
"Scalable Compression and Replay of Communication Traces in Massively Parallel Environments"
by M. Noeth and F. Mueller and M. Schulz and B. de
Supinski in P=ac2 Conference, IBM T.J. Watson, Oct 2006.
-
"Scalable Compression and Replay of Communication Traces in Massively Parallel Environments"
by M. Noeth and F. Mueller and M. Schulz and B. de
Supinski, refereed poster at Supercomputing, Nov 2006.